Growth & rewards
Charts & your daily read
Seven gentle cards of your own patterns, plus an optional once-daily read.
Charts are your analytics, kept gentle. They are here to help you notice your own patterns, not to turn your days into a scoreboard.
The six cards
- Focus calendar, a heatmap of the last year, with its own Month and Year window. Days you declared off are tinted a calm blue rather than left blank, so rest reads as intentional and not as a hole.
- Focus over time, as bars you can read by Day, Week, Month or Year.
- When you focus, your minutes by hour of the day, shown as a Daily avg or as your All-time total.
- By project or By tag, as a donut plus a ranked bar list underneath. One toggle drives both. The tag view includes a neutral Non-tagged slice for everything you never labelled.
- Energy over time, the last two weeks of your daily battery.
- Activity composition, how your all-time minutes split four ways: Focus, Rest, Physical and Social.
A seventh card, Wellbeing nudges, charts how you answered your nudges over the last thirty days, split into Honoured, Declined and Ignored.
A quiet week on the heatmap is information, nothing more. Nothing here is graded, and nothing here is shown to anybody unless you turn on the sharing row in Settings.
Ranges
The project and tag breakdown offers Week, Month and Year. Focus over time offers Day, Week, Month and Year, and the heatmap offers Month and Year.
Rest on the charts
On a stretch where every day was declared time off and no real focus happened, the focus bar does not go to zero. It draws a calm blue rest bar at your usual level, with a small legend saying what the colour means. A partly-off period shows only its real focus.
Yappie's daily read
At the top sits a short written read of how things are going, refreshed once a day.
With hosted AI on, this is a real AI summary, marked with sparkles. Under it is a feedback button, and what you write there stays editable until tomorrow.
Without AI, or on the free plan, you still see every chart. In place of the AI summary you get a shorter rule-based line, marked with a chip. On the free plan that card also carries an upgrade pill; with AI switched off it does not, because there is nothing to sell you.
The daily read is once a day by design. It is a calm check-in, not a running commentary.
A brand-new account
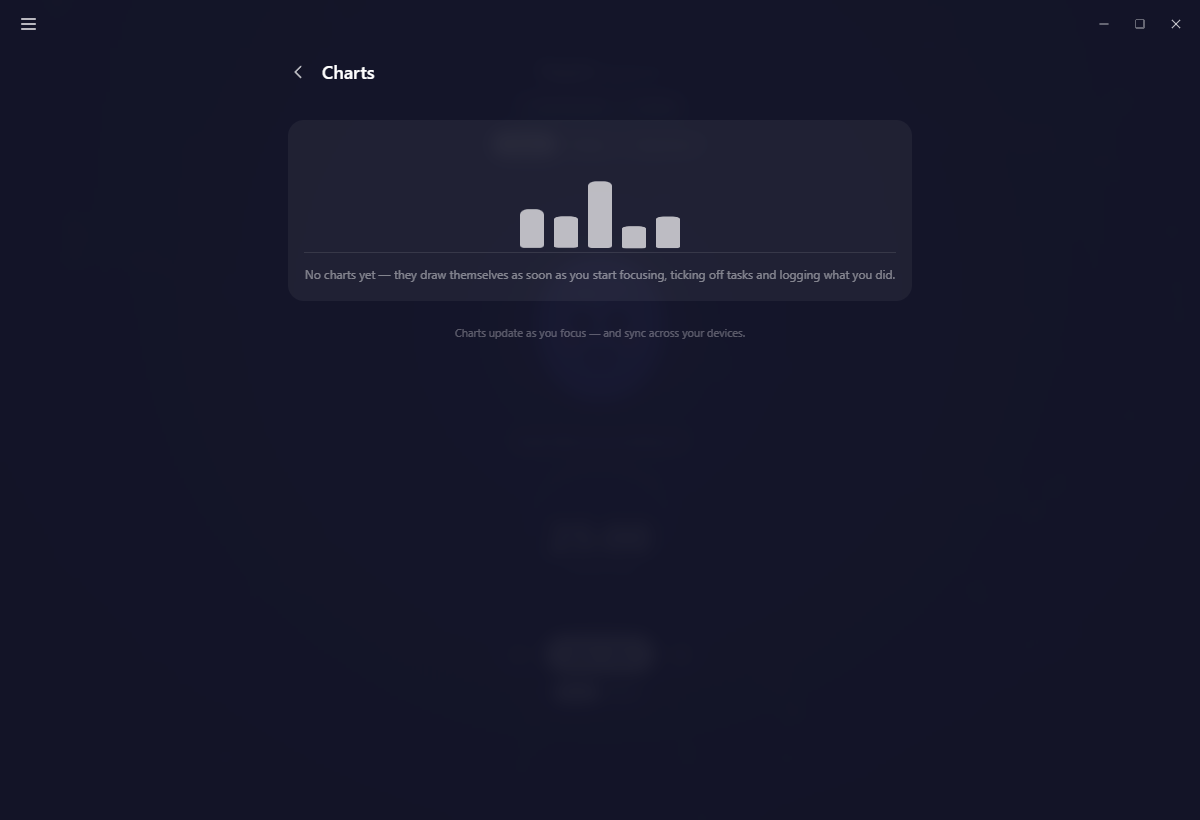
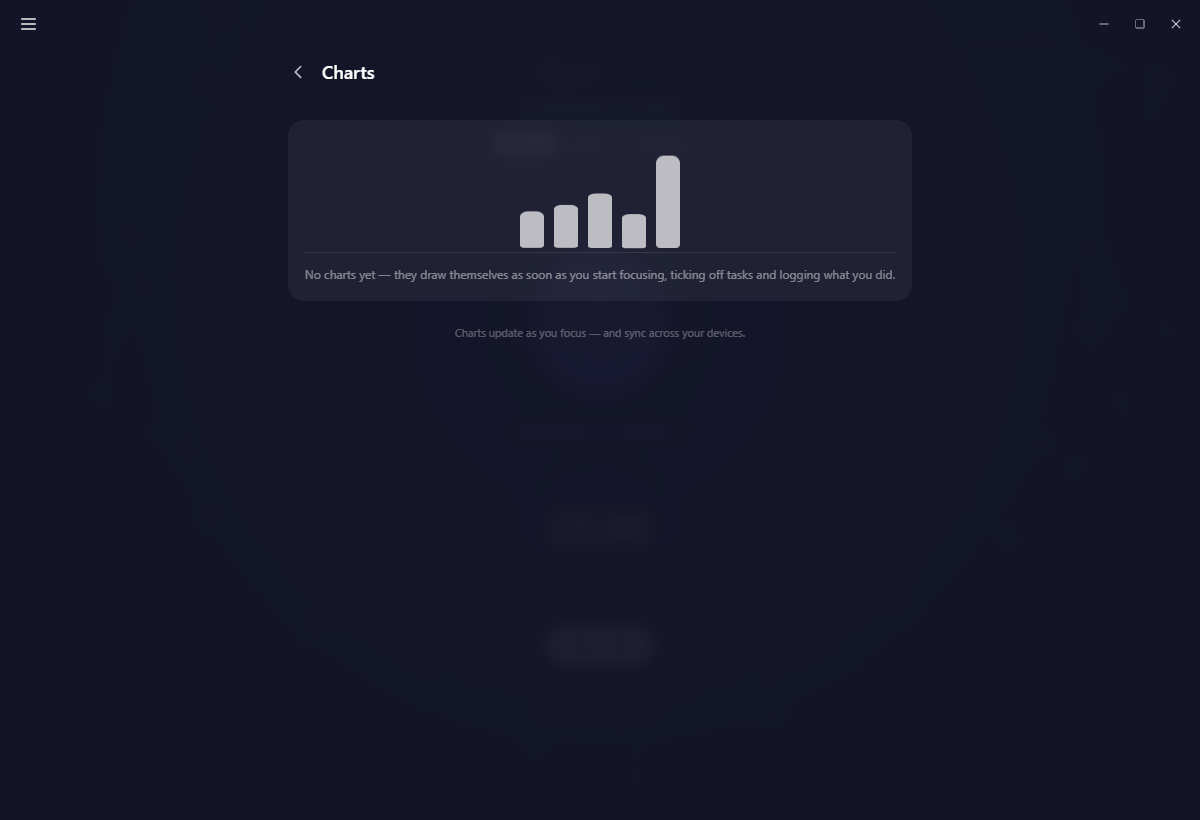
Before you have logged anything, Charts does not show seven empty axes. It shows a single card with a gently animating chart and a line saying the charts draw themselves as soon as you start focusing, ticking off tasks and logging what you did.
Finding Charts
- Desktop: open Charts from the menu.
- Mobile: the Charts segment of the Progress tab.
- Web: Charts in the sidebar.
Charts update as you focus, and they follow you across your devices once sync is on.
Next: Growth for the levels behind the numbers, and Yappie's energy for what the energy chart is measuring.
Last updated October 21, 2026